Believe it or not, the Fibonacci sequence has its place in Forex analysis. Below, we’ll delve into how the Fibonacci sequence came about and how it is used as an analysis tool for the Forex trading platform.
The Fibonacci Sequence:
If the word ‘Fibonacci’ isn’t familiar to you, the history of it goes back centuries when Mathematician Leonardo Fibonacci introduced an interesting string of numbers with an interrelated pattern. The sequence would go as the following:
0, 1, 1, 2, 3, 5, 8, 13, 21, 34, 55, 89, 144, 233, 377, 610, 987, 1597, 2584, 4181, 6765, 10946…
What was so special about these numbers? Well, every succeeding number is a sum of the previous two.
An interesting thing to note in this sequence is that each number is precisely 61.8% of the next amount in the pattern and 38.2% of the number two places ahead.
This came to be known as the Fibonacci sequence.
The Fibonacci Spiral:
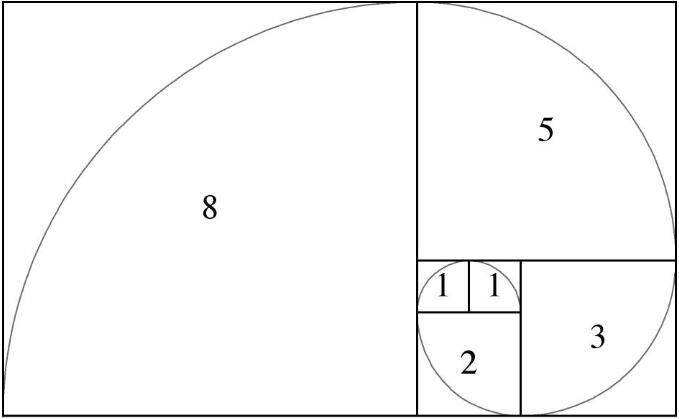
Of course, if you still think the Fibonacci sequence is new to you, then perhaps you have seen the pattern in the image below:
This spherical pattern incorporates the Fibonacci numbers, taking the first arc, and adding the previous to make a longer one to infinity. Apart from just math textbooks and the like, you may have seen this pattern elsewhere. Here are a few examples:

Of course, all these do bring about an appeal to the eye. But how does all this fit within the world of Forex trading or even Forex analysis for that matter?
The Fibonacci Analysis in Forex Trading:
When it comes to applying the Fibonacci sequence into your analysis, how does one go about doing so?
An example could be if an up-trending currency pair were to become bullish suddenly and price direction reverses. With the help of Fibonacci ratios, you can figure out how long the price would continue dropping until it starts to pick back up again and you can already formulate a plan beforehand.
When a market trend changes course, it is highly likely that the trend’s direction would be equal to 38.2% or 61.8% of the previous trend, depending on the route. This is as so because traders are likely to switch sides when exchange rates hit either of these percentages.
With this, we will take a look at how to analyze charts with the Fibonacci pattern.
Fibonacci Retracements:
Fibonacci Retracements are considered a popular tool and is offered by almost every Forex trading platform. It involves a Basic trend drawn as a line on the chart. When you manually adjust the Basic trend, Fibonacci levels are automatically drawn on the price chart.
Then, when you settle on your Fibonacci Retracement instrument on the chart, you will get the horizontal lines which will indicate the levels 0.00, 23.6, 38.2, 50.0, 61.8, and 100. From here, you can start your analysis. We will explain further with the following:
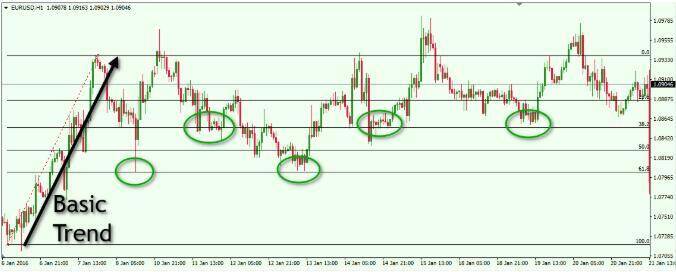
In this example, we will use a 60 min chart of the EUR/USD currency pair, within the time frame from January 6th to January 21st of 2016. With the image above, the primary trend is marked from the bottom to the top of the direction. The horizontal lines on the chart mark the percentages based on the Fibonacci sequence.
With that done, notice how after the end of the upward trend, the price drops but gains support at the 61.8% of the Fibonacci retracement level. After this jump, the prices drop to test the 38.2% retracement level. You will see that the price level is checked about three more times.
This type of analysis can be used as part of a strategy or by itself as a trading method. A simple way to use this is to swing long whenever the price bounces from 61.8% to 38.2%. Then, place a stop-loss order just under the area the price rebound. If the prices move in your favor, adjust the stop upwards. If the price breaks a new level, move the stop to the middle of this level and the lower one. Hold the trade until the price reaches 0.00% or until the stop-loss threshold is triggered.
Another useful tool based on the Fibonacci ratios. However, it takes a different form on the chart. The setup is the same, with the primary trend line drawn towards the uptrend, and the only difference is to identify the trend and stretch the indicator on it. The rest of the components will be drawn automatically. These other components consist of diagonal lines distanced with 38.2%, 50.0%, and 61.8% from the top of the trend. Once the Fibonacci Fan has been placed on the chart, you can commence your observations.
In this Daily chart, we see the EUR/USD pair for the time frame of May 30th to November 3rd of 2010. The Fibonacci instrument is placed, as marked by the Basic trend line. The small black arrows are the areas where the prices bounce according to the Fibonacci levels, and the red circles are the ones that broke the pattern.
As you can see, the price interacts with the trend lines. After the upward trend, the price drops through the 38.2% level and bounces back up once it reaches 50.0 and so on.
With the Fibonacci fan, you can adopt a simple trading system where every time the price would bounce from 38.2% or 61.8%, and a long position would be opened. Stop losses should be placed under the bottom of the tests. The trade could be held until the price breaks one of the fan levels in the bearish direction.
Do keep in mind that this is an overly simplistic example and that you can fully make use of this tool in combination with other crucial support and resistance levels with the Fibonacci retracement levels.