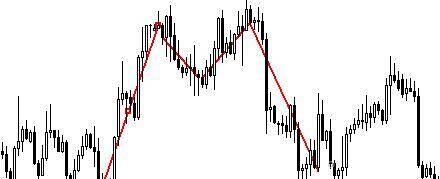

Forex chart patterns are indicators that bring off above average signals for a specific direction. These patterns project significant hints which are helpful for price action traders. Such is necessary since they much help traders in the Forex decision process. Chart patterns have a command to swing a price to a new one. With this, Forex traders take advantage of chart patterns to analyze upcoming price movements.
TYPE OF CHART PATTERNS
There are three types of chart patterns. These are called Continuation Chart Patterns, Reversal Chart Patterns, and Neutral Chart Patterns.
- CONTINUATION CHART PATTERNS
This appears when the price is trending. If ever there is a continuation chart pattern during a trend, this denotes that the price is correcting. It also signifies that a new price movement heading towards the same direction is about to happen. Renowned continuation formations are pennants, rectangles, and corrective wedges.
- Pennant Chart Pattern

The pennant pattern usually shows up as a corrective and consolidating price move. This occurs during trends. It looks like a symmetrical triangle which is bound by trendline support and resistance lines. This can either be bullish or bearish according to trend direction. This can either be bullish or bearish according to trend direction. When this appears during a trend, it can potentially push the price towards the course of the overall trend.
You should open a position if a price closes a candle far enough from the pennant. A stop loss needs to be placed at the opposite level of the pennant.
- Rectangle Chart Pattern

This can also be considered a trend continuation formation and is very much similar to price consolidation inside horizontal support and resistance levels. It is likely to have a new movement if the price starts moving sideways creating a triangle. This is also reliant to trend direction, whether it is bullish or bearish. Remember to put stop loss at the opposite extreme of the triangle if you want to trade in this kind of pattern.
Corrective Wedge Pattern
There are two types of a wedge; the corrective and reversal wedges. What’s interesting about this pattern is they could be a trend continuation or trend reversal formation. They look the same and are dependent on the previous price movement.

Corrective wedges show up as a retracement opposite to the trend direction. Once you have an uptrend and a falling wedge, it is a corrective falling wedge in a trend continuation form. Another case is, if you have a downtrend and a rising wedge, it is a corrective rising wedge in a trend continuation form. If you want to trade collective wedges, make sure to put your stop loss beyond the side, inverse to the breakout.
- REVERSAL CHART PATTERNS
These patterns appear at the end of a trend. When these patterns show up, they imply that a current trend is about to end, and the opposite movement is about to begin. The most common reversal chart patterns are double (or triple) top or bottom, head and shoulders, reversal wedges, ascending/descending triangle.
- Reversal Wedge Pattern
Reversal rising /falling wedges are very much similar to corrective rising/falling wedges. The only difference they have is how the wedge and trend direction interact with each other. Note that rising wedges have a bearish indication. It means that increasing wedge swings the bullish trend in the opposite direction while keeping the bearish trend. Otherwise, action can be noted when falling wedges reverse bearish trends and follow bullish trends.

Head and Shoulders Pattern
Head and shoulders pattern can be considered as one of the most trusted chart patterns in technical analysis. It is called as such since it heavily resembles a head and shoulder. This figure happens due to reversal formation and topping reversal right after a bullish trend occurred.
Its counterpart is called inverted head and shoulders which usually happens after a bearish trend.

If a price closed far from the neckline, the head and shoulders are established for you to make a trade with the respective position. It is essential to place a stop loss just above the last shoulder of the figure.
- Ascending Triangle Pattern/Descending Triangle Pattern
An ascending triangle pattern is that one which has three successive tops of the same height but with lower swing bottoms while a descending triangle pattern is that which has three bottoms at the same level with lower swing tops.
When an ascending or descending triangle showed up, there is a higher chance of having a price movement equivalent to the expanse of the figure.

- NEUTRAL CHART PATTERNS
These formations indicate that a new price movement will happen. Such patterns may occur during trends or non-trending periods. Though these patterns do not disclose as to which direction the price will move, it is still helpful since you can trade to an upcoming move.
- Symmetrical Triangles

Symmetrical triangles have two sides bearing the same size. The symmetry of these two sides produces a technical force equivalency which makes this a neutral figure.
If this formation showed up, a price movement is about to happen equivalent to the size of the figure. Though this is the case, its direction is unknown due to the symmetrical sides of the triangle. If you opt in trading symmetrical triangle, it is wise to place a stop loss far from the opposite end of the breakout point.
All of the charts mentioned above can be considered as a measured move price potential since these patterns tend to move a price equivalent to the size of the figure.
