
If you’re tired of continually analyzing charts filled with indicators, then the discussion below will help you analyze the market more comfortably and efficiently.
WHAT IS PRICE ACTION TRADING
This is a classic method of trading in which decisions are derived from previous price behaviors. It means that traders analyze current market conditions with minimal help from indicators, signals, or oscillators. Price action trading is considered as the purest way to assess the market and the most productive way to trade since it helps traders with the following:
1. Trend Identification
Identifying ongoing trends is of high importance in a price trading strategy. “The trend is your friend” is deemed correct since knowing current price trends will bring you exponential profits. That’s why it is essential to trade in line with the current trend if possible.
2. Avoiding Consolidations
Price consolidation is when the price is heading towards the unconfirmed and vague direction. If there is any indication, it is that the price is not increasing or decreasing. It is treading sideways, and the trading viability is low. The best way to avoid losses is to opt-out from trading if the price is consolidating.
3. Finding Reversals
Some traders exhaust currency pairs when trend lines falter. The reason behind this is that trend reversals allow traders to be in the market at the starting point of a trend. Traders grab this opportunity to increase the potential reward to risk ratio offered.
4. Analyzing Corrections
Traders feel that corrective trend movements are not necessary since regular trend movements give out better trading opportunities. But if you want to trade corrections, they still have profitable opportunities to offer. Also, you should develop expertise in market timing.
POPULAR TOOLS WHEN TRADING PRICE ACTION
Though indicators are not much of a help in price action trading framework, price action traders still utilize various chart patterns.
1. Support and Resistance
Support serves as the base, and resistance is the ceiling in which a current price is reacting. Such levels can easily be identified on charts. If ever a price attempts to go through a specific level several times in bullish direction, then this level is called resistance. Just when a price approaches a particular level in a bearish trend, then it is a support.
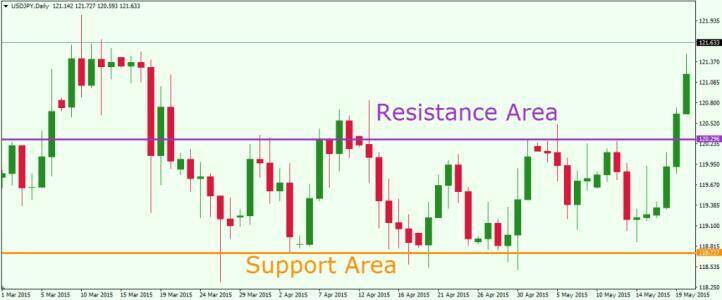
Be mindful that support can break and turn into resistance. More so, strength can break and become a supporter. Traders use these levels to identify their exit and entry points in price action trading.
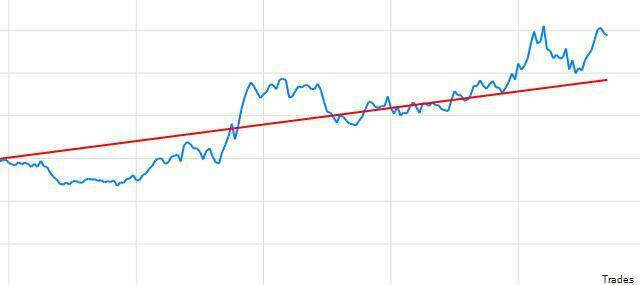
2. Trend lines
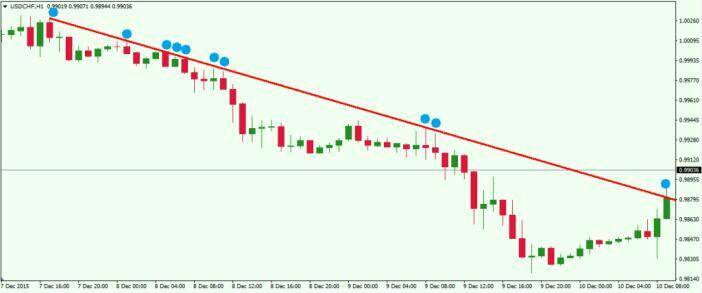
Trend lines work the same way as support and resistance do. Their only difference is that a trend line is inclined. To confirm a trend, there has to be a series of bottoms and tops connected using a tilted line.
If a price bounces off the trend line, traders should enter a market. If a price approaches a trend line, this confirms that it is the best time to exit a trade.
3. Channels
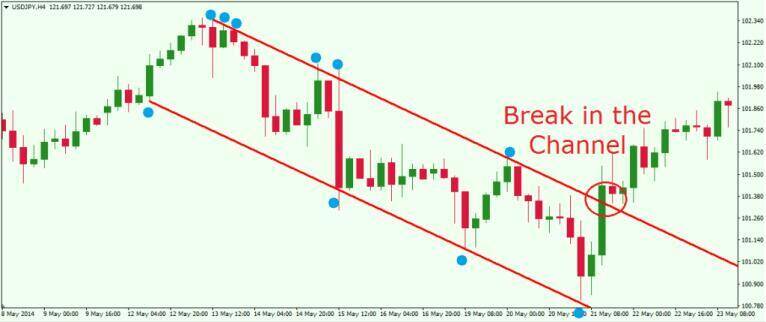
Price channels similarly work as trend lines. Their difference is that channels have another level that serves as the hall in which a price reacts. If ever a channel appeared on the chart, the cost can bounce in ping pong ball manner from upper down to lower level of the channel. It gives out traders an idea of how long a current trend will last, and when will it change direction.
4. Candlestick Patterns
Candlestick formations are helpful since they give out price potentials. Some of the most common candlestick patterns are,
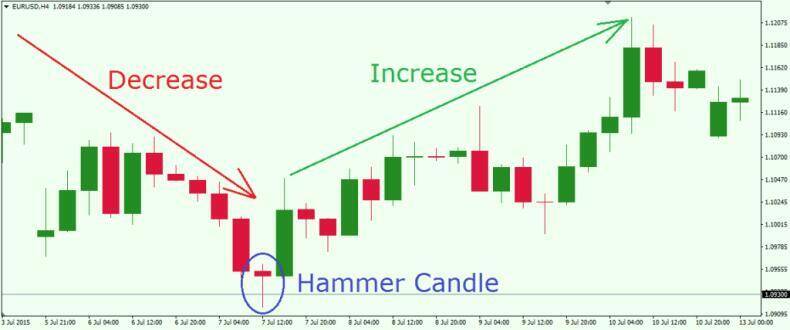
A. HAMMER AND HANGING MAN
Hammer and hanging man look similar since they both possess a long bearish wick and ahead. What sets the difference is their indication. Hammer is usually located at the end of a bearish trend to denote a possible reversal. Hanging man can be found at the end of a bullish trend indicating an upcoming reversal.
B. INVERTED HAMMER AND SHOOTING STAR
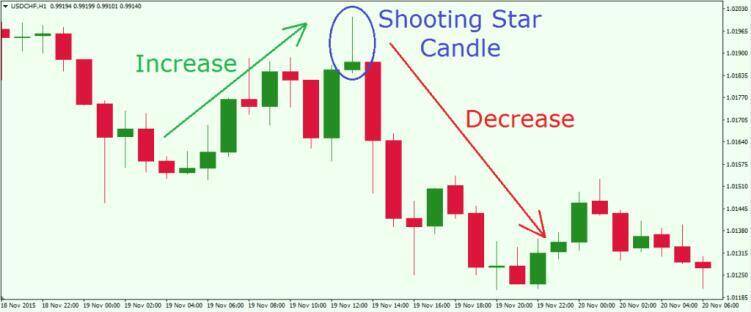
The inverted hammer and shooting star look precisely the same as they both have a lower body and a long bullish wick.
The inverted hammer has the same purpose as the hammer. Once it appeared at the end of the bearish trend, it signals a price increase. If the shooting star looked at the chart, it denotes a price decrease.
5. Chart Patterns
Chart patterns are those specific formations and figures which show hints about possible trend continuation and reversal. Their unique trait is the ability to project and bring out viable targets to position a trade.
A. DOUBLE TOP AND DOUBLE BOTTOM
These are reversal chart patterns. This commonly appears when at the end of a trend, the price makes two tops bearing the same height. The bottom between these two heads is called a signal level. Once the movement breaks through the signal level, it is best to open a position in congruence with the figure.
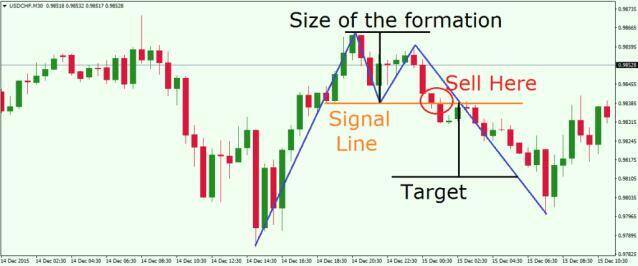
The same works with double bottom. They differ because it is an upside-down version of a double top. It usually appears at the end of the bearish trend and has commanded to reverse the price movement like the double top. With that, trade the same way as the double top but position it on the opposite.
D. HEAD AND SHOULDERS
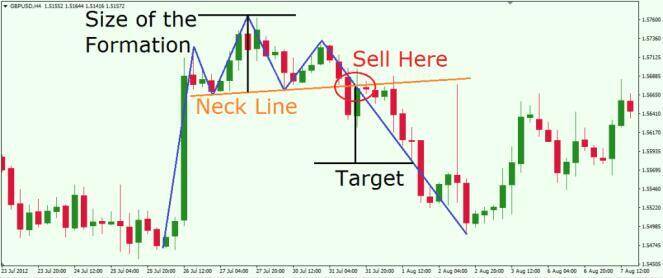
This is considered as one of the most reputable chart patterns. This kind of formation comes with three successive spikes with the middle one being the highest. It is called such since it resembles a man with head and shoulders. Inverted head and shoulders work precisely the same, but it shows up in an upside-down form. It is wise to open a trade just when the movement breaks through the neckline.
The patterns mentioned above are fractal; thus, they can show up in any timeframe and charts.