
In the world of finance, Pivot Points are price indicators used by traders to determine support and resistance levels to make better decisions when trading. In this article, we will look into the pivot point basics, how to calculate them along with how to use other variations.
History of Pivot Points
Pivot points have been around for a long time – with the points seen as price levels to calculate to fuel market sentiment during a period.
Originally, pivot points were generally used in the futures market, where floor traders would calculate pivot points on the financial instrument after determining the previous day’s high, low, and close. This would help them find essential market levels and keep them from making losses.
Today, it is especially helpful in the Forex market and is used pretty much the same way it was back then.
Trading with Pivot Points
In the world of finance, an important aspect is that of support and resistance levels. While no one can correctly predict the directions of a market trend, understanding these levels can help the trader find points of interest as well as find approximate areas as to where turning points may occur.
There are many variations of pivot points to incorporate into your trading. However, in this section, we will look into the primary strategies for trading with pivot levels.
- The first strategy involves using the levels to initiate breakout trades.
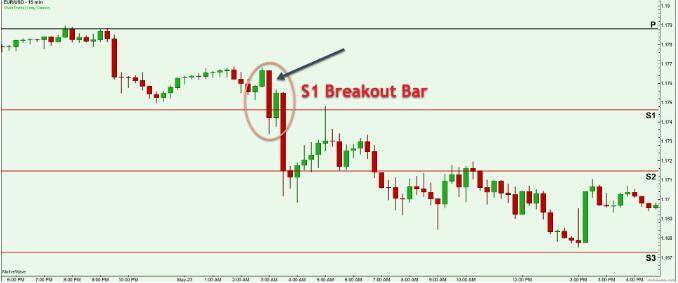
In the encircled area above, a strong bear candlestick breaks the Support 1 (S1) level and closes below it. This is considered a pivot point breakout setup.
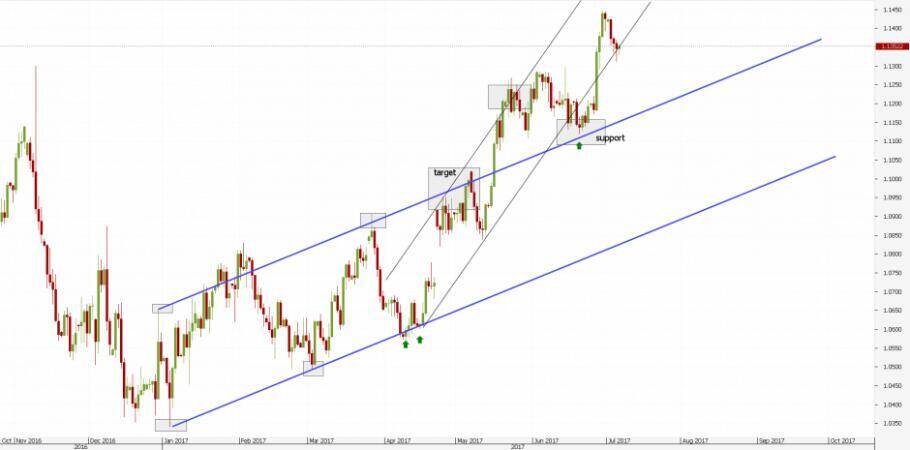
- The second strategy is using the levels to take reversal trades.

In the encircled area in the example, you will see that the price climbed steadily but is later met with a hammer candle form on the Pivot (P) level. More then, it retested the Pivot (P) but plummeted sharply afterward. This is considered a Pivot level reversal.
Standard Pivot Points
Standard Pivot Points, which are also known as Floor Points or Classical Pivot Points, are the most commonly used points out there.
To calculate these, the baseline Pivot Point (P) will have to be determined using the formula:
Pivot Point (P) = (High + Low + Close) / 3
From here, we find the two support levels (S1 and S2) and resistance levels (R1 and R2), which will be determined from the center or mid-point.
To find (S1), the calculation is as follows:
S1 = (Pivot Value X 2) – Yesterday’s High
Next is (R1). Which would be determined using the following formula:
R1 = (Pivot Value X 2) – Yesterday’s Low
With the first resistance (R1) and first support (S1) figured out, the formula for the second levels of support and resistance would go as follows:
S2 = Pivot Value – (High – Low)
R2 = Pivot Value + (High – Low)
Woodie’s Pivot Points
A variation from Standard Pivot Points is Woodie’s Pivot Points. When calculating these points, it would be done with the following formula:
R2 = PP + (High – Low)
R1 = (2 X PP) – Low
PP = (High + Low) + (2 x Closing Price) / 4
S1 = (2 X PP) – High
S2 = PP – (High + Low)
The main difference between this formula and the Standard Pivot Points formula is that it is more focused on the closing price. This may seem confusing at first glance, but basically, it works similar to an Exponential Moving Average, where the following data is weighted more heavily than the earlier data.
Camarilla Pivot Points
Camarilla Pivot Points found its invention in the late ’80s by Nick Scott and are quite similar to Woodie’s pivot points in a way that they use the previous day’s closing price and range to compute levels.
However, instead of calculating just 2 Support and Resistance Levels, the Camarilla formula would require 4 Resistance and 4 Support levels along with the Pivot Point level. This results in a total of 9 levels. An exciting part of this formula is that there is a special multiplier in the formula.
The formula goes as follows:
R4 = Closing + ([High –Low] x 1.5000)
R3 = Closing + ([High –Low] x 1.2500)
R2 = Closing + ([High –Low] x 1.1666)
R1 = Closing + ([High –Low] x 1.0833)
PP = (High + Low + Closing) / 3
S1 = Closing – ([High –Low] x 1.0833)
S2 = Closing – ([High –Low] x 1.1666)
S3 = Closing – ([High –Low] x 1.2500)
S4 = Closing – ([High-Low] x 1.5000)
The idea the formula revolves around is that the markets are cyclical in nature. This means that a strong price from a previous session would revert back to its value range the next day.
Fibonacci Pivot Points
Fibonacci retracements, extensions, and projections are some of the more popular analysis tools in Forex. Fibonacci levels that traders mostly concentrate on are 38.2% and 61.8% retracement levels. These percentages can be found when looking into the Fibonacci sequence.
For Fibonacci Pivot Points, the formula goes as follows:
Resistance 1 = Pivot + (.382 * [High – Low])
Resistance 2 = Pivot + (.618 * [High – Low])
Resistance 3 = Pivot + (1 * [High – Low])
Pivot Point = (High + Low + Close) / 3
Support 3 = Pivot – (1 * [High – Low])
Support 2 = Pivot – (.618 * [High – Low])
Support 1 = Pivot – (.382 * [High – Low])
The initial computation for Fibonacci levels is very similar to the Standard Pivot Point by using H+L+C / 3. From here, we multiply the range of the previous days with the specified ratio. Lastly, to find the Resistance levels, you add the result to the pivot point. To find the Support levels, you subtract the result to the pivot point.