
The ADX Trend Indicator or Average Directional Movement Index Trend Indicator is a popular and useful tool known for its versatility. Many traders and investors use it to determine the strength of a particular asset’s market trend. Using this indicator in an ADX Indicator strategy in of itself may not help in predicting where the market trend is heading. Though, you could use the Directional Movement lines to figure when to buy or sell a position.
When using the indicator in an ADX Trading Strategy, you can bring back any of the values between 0 and 100. A threshold above 25 is considered to be a trend of interest. Any value between 25 and 50 is a signal for a trend to be gaining strength. In line, a value between 50 and 75 is seen as a strong trend, and 75 to 100 can be seen as a very strong market trend.
A popular ADX Trading strategy is the ADX Crossover Strategy which we will be looking into below:
How to use the ADX Crossover Trading Strategy
The ADX Crossover Strategy (or sometimes known as Wilder’s ADX DMI trading strategy) is one that was developed by Wilder and involves the use of the directional market movement lines (+DI and –DI). The idea behind this ADX Trading Strategy is opening or closing a trade fully depends on if the value of the ADX reaches above the threshold of 25 and over.
The ADX crossover strategy is basically a buy-sell signal depending on whether a particular threshold has been crossed or not. A buy signal would be sent once the +DI crosses above –DI, and a sell signal is sent once the -DI crosses above +DI.
Stop-loss orders would be placed at the lowest in the recent trading day, with the trades remaining valid despite the market lines (+DI and –DI) cross more than once after the first signal. However, the trade setup will only be considered invalid is if the day’s low has been breached.
As long as the ADX were to stay above 25, placing a trailing stop order would be most appropriate.
In order to understand this ADX Trading Strategy further, we will explain in a couple of examples.
• Example #1
In this scenario, let us look at a daily chart of the popular forex pair EUR/USD:
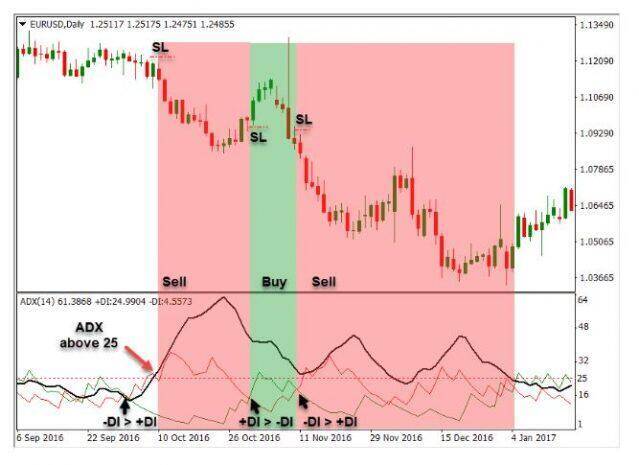
As you can see, the –DI first crossing the +DI did not send a sell signal.
This is because the ADX was set on the current daily low of 25 and below. However, the sell signal was triggered after the ADX breaking through the 25 thresholds even if the –DI and the +DI did not cross, and the –DI line stayed above the +DI line. In this example, the stop-loss order (indicated by the dotted line on the chart) was positioned just above the current day’s high.
The next signal that triggered a buy signal is the crossing of the +DI above the –DI. Keep in mind that the ADX remained above the 25 thresholds. This definitely implies a strong trend in the market.
The last signal (the sell signal) showed once more like the –DI crossed the +DI upward. The trade setup remains the same as the ADX above 25, and the stop-loss just higher than the current day’s high.
With this ADX trading strategy, keep in mind that while it can be implemented to charts with smaller timeframes, it can oftentimes leave room to a lot of incorrect signals due to the erratic nature of market movements when viewed up close. Therefore, this ADX trading strategy is much better used on a wider timeframe to make the most out of it.
• Example #2
In the next example below for using the ADX trading strategy, we had used a five-minute chart with buy and sell signals. The placing of stop-loss orders have values that are marginally changed from what was used in the example above. Here, the stop-loss orders have been moved to the current highs and lows of the day’s price. The ADX remains at the 25 thresholds.
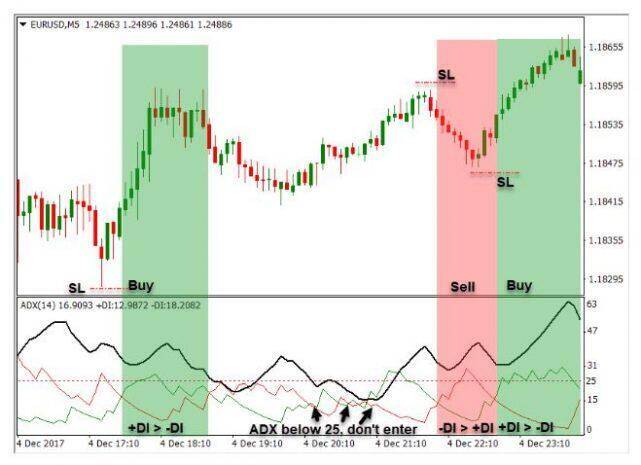
Here, it starts with a buy signal which was triggered after the +DI crossed above the –DI trend line. In the following directional market movement of the lines afterward, you will see that the trend lines have managed to cross each other a few times over.
However, since the ADX in this ADX trading strategy example is located at the threshold of 25, no further signals have been triggered.
Later, a sell signal is sent after the –DI line crosses above the +DI. Lastly, a buy signal is sent after the +DI line crosses above the –DI line.
Read more: