
The ADX Indicator (or the Average Directional Index) is an analysis tool that is widely utilized by traders all over to measure the strength of a current trend in the market, whether it’s an upward, downward, or trendless. While the ADX Indicator is popular, not many fully know how it works, which is why in this article, we will look into what is ADX Indicator and how to use ADX Indicator for day trading.
How ADX Trend Indicator works
As mentioned, the ADX Indicator or sometimes known by some technical analysts as the Directional Movement Index (DMI) Indicator, is basically used to calculate the strength and direction of a trend. The ADX indicator can be used in almost any asset and market instrument. The ADX Indicator formula is composed of the following three elements:
- + DI
- – DI
- ADX Line
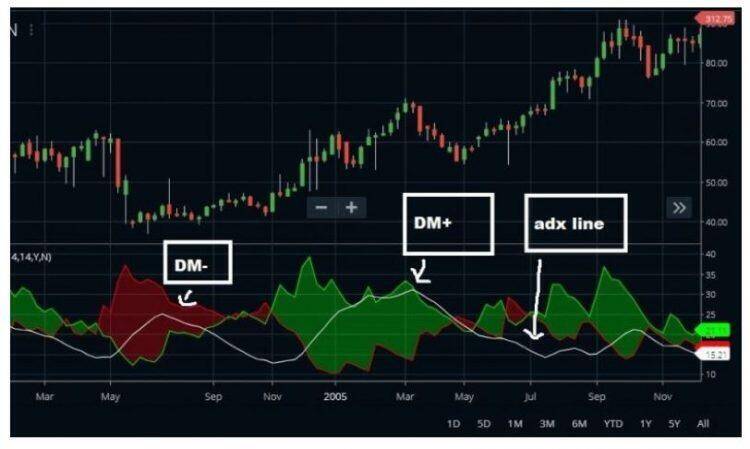
The +DI and –DI form indicates the direction of the movement for the ADX Indicator trend line, where traders can pinpoint as to whether the market is bearish or bullish. The ADX line indicates the strength of the direction.
Putting the three components together would provide an ADX technical indicator of the existing market condition. The ADX Indicator is depicted in the sub-window of the price chart. This can also be considered an ADX indicator PDF or one akin to where a technical oscillator is plotted.
How to Use the ADX Trend Indicator
While there are many ways and strategies to implement the ADX Indicator, we will first focus on how to use the ADX Indicator MT4 (or MetaTrader 4).
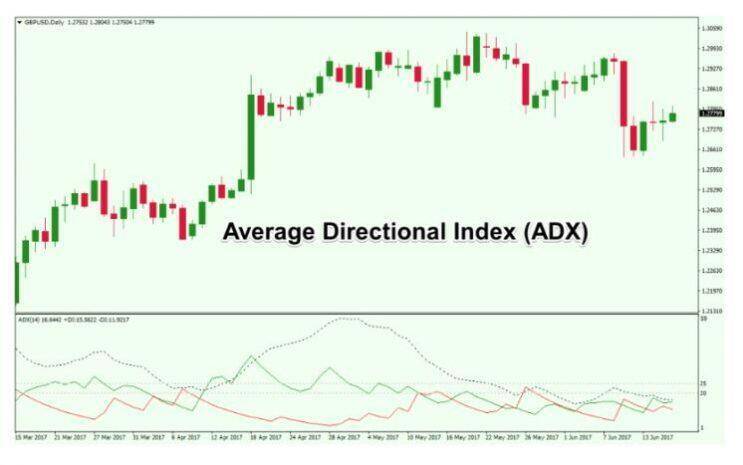
According to the image above (and according to your ADX Stock Indicator you are using), you may find that the ADX Indicator shows three lines where the dotted black line represents the trend’s strength, the +D is the green graph line and the –D is the red graph line. When reading an ADX Indicator chart, a red graph line above a green graph line shows a negative or bearish trend. In contrast, a +DI reaching above a –DIit shows a positive or a bullish trend.
What is ADX Indicator Setting
When using an ADX Indicator, it is crucial to understand how ADX Indicator settings are plotted in order to use it to the best advantage fully. In today’s modern age, manually calculating these values is have obsolete when using the ADX Indicator as most trading platforms have in-built calculators that can do it for you automatically.
When calculating the ADX Indicator, it can be done by collecting the value of the aforementioned +D, -D, and ADX Line. Where:
+D is determined by the following:
Current High Price – Previous High Price
Where the previous high should be greater than the value of the previous low, subtracted from the current low.
-D is determined by the following:
Previous Low Price – Current Low Price
Where the current low price should be greater than the current high subtracted from the prior high.
The Average Directional Index or ADX line is based on the calculation of the true range, the +DI and -DI for each period, then smoothed. This is the input parameter for the ADX period. The typical default value of the ADX indicator is 14 period. So, this 14 period becomes the smoothing period for the ADX line.
Conclusion
The ADX Indicator strategy can be used for day and swing trading as well as for strategies that involve long-term position trading. Trends tend to be accurate when viewed at longer timeframes just above the lowest. Either way, the ADX Indicator is an extremely useful and popular tool that traders use that implements the use of a trend’s strength and direction.
Read more: