
The mid-direction index is a type of trend indicator that determines the strength of a trend, whether it is bullish or bearish. ADX is useful in analyzing charts as it measures how strong or weak a trend is.Trends occur only in 30% of cases on the market.
Approximately 70% of daily trading results are in the lateral range, which does not confirm or deny that the trend continues.
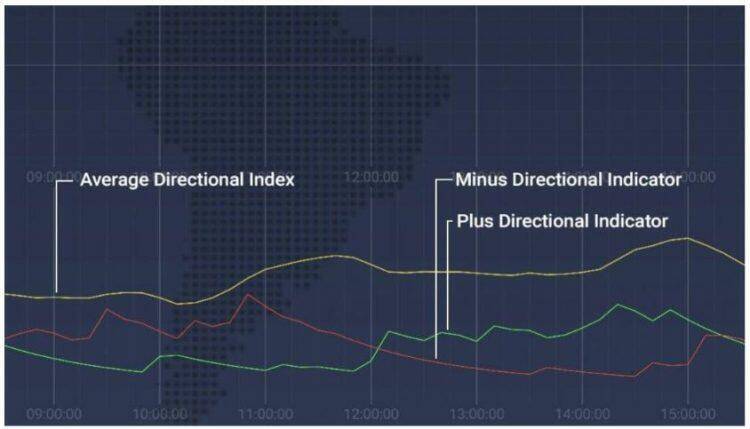
Interpretation of the ADX Trend Indicator
The ADX indicator does not necessarily determine the direction of the trend, but shows how strong it is.
It represents a value in the range from 0 to 100, depending on how strong or weak the trend is.
On weak trends or when the market moves in a range, ADX may indicate 0-25.
This value can go up to 50;
however, as soon as the ADX reaches 25, traders already assume that these are good trading conditions.
When the ADX value exceeds 50, which is quite rare, this is a good indicator that the trend is strong and will continue.Reading up to 75 and above indicates that the trend is extremely strong, which allows traders to rely on market rates in their trading decisions.However, this almost never happens, as readings of 75 or higher usually indicate that the trend is nearing its end or will move in the opposite direction.
An ADX value chart is shown below:
|
|
Trend Strength |
| 0-25 | Missing or weak |
| 25-50 | strong |
| 50-75 | very strong |
| 75-100 | very strong |
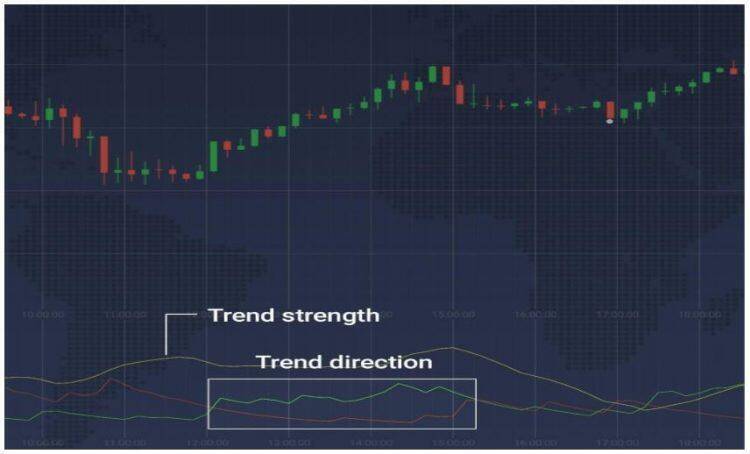
Using ADX and DMI Lines
Along with ADX, the graph also shows the lines of the DMI indicator or directional indicator, which are the positive and negative lines that determine the direction of the price.
+ DMI and -DMI are the lines from which ADX gets its data.
Using the DMI lines, you can determine that the price is going up when -DMI is lower than + DMI.
ADX uses this data to determine the strength of the current trend.Naturally, you can assume that the price goes down when + DMI is lower than -DMI.
Trading with the ADX Indicator
The ADX indicator measures whether the market is moving in a range or whether a trend is inevitable or strong.
This is comparable to indicators that separate market noise from legitimate trends.
When you use ADX, you can see that the price usually moves within 0-25 steps, and only occasionally breaks above it.While reading 0-25, this indicates that the market is rising and falling in a certain range. This is almost guaranteed when the chart shows 30 consecutive bars in a range.
When you observe a price movement at this time, you will see that it is trying to break out of the range, regardless of whether it is higher or lower.As soon as the ADX shows a value above 25 or even more, this indicates that the price has broken free from any level. DMI lines will show in which direction the trend is going.
Then ADX can tell you how strong it is.
Remember that ADX does not indicate a trend direction. The ADX rising line indicates that the current trend is strengthening, and when it goes down, it indicates that the current trend is weakening.
Please note that when it goes down, this does not mean that the current trend has reversed;
it only indicates that the strength is becoming weak, due to various factors. Refer to DMI for price direction.
Conclusion
The ADX trend indicator will show you how much you can rely on the current price movement; and whether your decision will result in long or short, most likely profit or loss. This is a percentage of your chances of making a profit, whether you open a long or short position.Together with the DMI lines, these are reliable indicators that can be used in assessing the market.
You are more likely to get good trading results if you base your decisions on two.
Read more:
How to use ADX trend indicator
ADX Crossover Trading Strategy