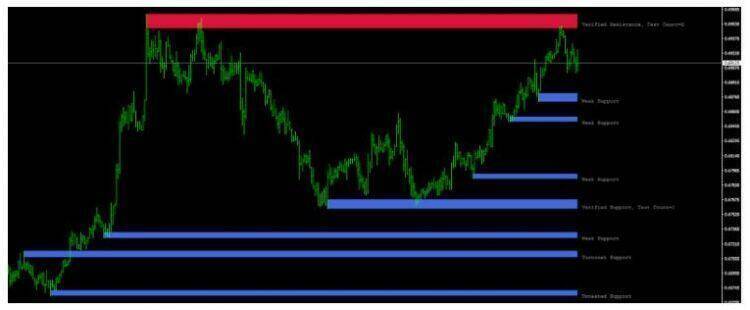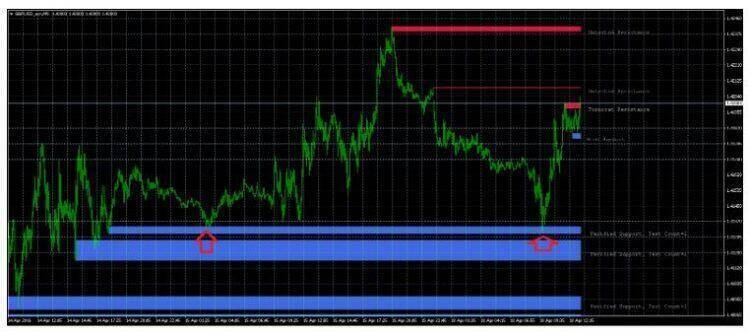
There are many trading strategies on Forex, but to find a really working strategy among them so that it makes a profit in the long term, this is a rather difficult task. However, there is a true working strategy that works at all times – this is trading from levels. You all know that price tends to fend off important price levels; we have already written about this in our articles several times. But it’s not easy for beginners to identify strong horizontal levels, so we suggest using the SR_zones indicator, which itself finds levels on the chart. You just have to open a deal, set a safety stop-loss, and set goals for taking profits. You can also read about it in the articles Trading the Bounce (Reversal) from Pivot Points and Trading the Break of Pivot Points.
At the same time, the Pivot point trading strategy by levels is so simple that it can be used even by a beginner who has recently traded on Forex. This is a proven strategy that has been tested both by time and by the positive trading results of practicing traders. See also the rating of Forex brokers, in which you will learn how to distinguish a reliable broker from numerous “cuisines” and you can find a decent brokerage company.

Trading Strategy Characteristics by Levels
Trading from support and resistance levels is universal Pivot Points, and it can be used both on small timeframes (M5 and M1) and on long-term time intervals (H1, H4, and D1). The only drawback of the SR_zones indicator is that it redraws a bit, that is, those levels that the price managed to break through disappear on the chart, so it can’t be checked on the history. But on the other hand, after breaking through, the level loses its significance in the future, so the redrawing of the indicator Pivot Points, in this case, is even a plus than a minus. To reduce the number of false signals, use it on H4 and D1 timeframes, although some traders successfully use this indicator on minute timeframes as well, making an additional profit on intraday fluctuations. It is recommended to use the major majors – EURUSD, GBPUSD, USDJPY, and others as currency pairs. When a simultaneous signal appears on several crosses, we advise you to open only one deal, choosing the most accurate and beautiful signal.

Login Rules Pivot point trading strategy
You can enter into transactions with both market and pending orders. For example, the price is moving down, and there is a support zone on its way. The best option would be the presence of confirming Price Action setups, for example, a pin bar – candles with a small body and a large tail piercing this level. The price seems to be testing the level, trying to break through it, but bouncing off of it. If the candlestick closes below the level, then you can’t enter on the rebound from it, since most likely there will be a breakthrough the level. The price should test the level at least twice before entering the deal. The more bounces there are from the level, the stronger it is. Stop-loss can be placed behind the support and resistance zones Pivot Points. The indicator is convenient in that it marks the levels on the chart not with horizontal lines but with zones; therefore, there should not be a problem with setting a stop loss. But the goals for taking profits can be other levels that stand in the way of the price and multiplying the stop loss by two or three times. The direction of the trend and the presence of a flat market should also be taken into account. If you are trading against the trend, then the goals for taking profits should be minimal; otherwise, the price may turn around and continue to move along the trend.


