Fibonacci levels are one of the most universal and common tools that beginners and experienced traders actively use in their work in the Forex and other markets. It is well known that the market price tends to gravitate to levels where the largest volume of market orders accumulates. And in this regard, there are several search and prediction techniques for such levels. Read about it in the article Fibonacci Retracement Definition & how to use it.
System building and levels
Based on various levels, trading systems are being built. Fibonacci retracement levels have been used in trading for a long time – as soon as traders saw that price fluctuations for certain assets often repeat the Fibonacci number sequence and quite clearly. The tool is so effective that it is part of the standard settings of MetaTrader4 / 5, a trading platform that is by far the most popular and in demand.
Options for using the Fibonacci method
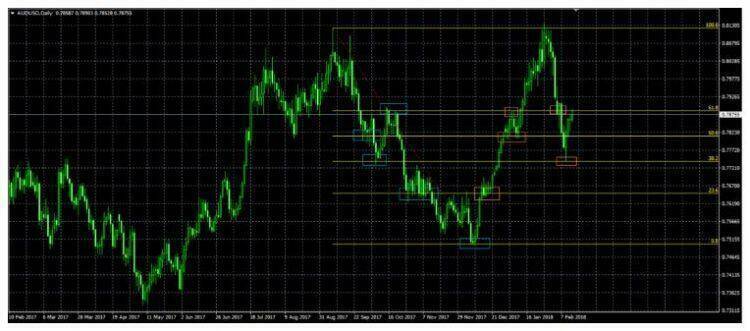
Pay attention to how exactly these lines indicated support and resistance levels on the existing part of the chart (these places are highlighted with blue rectangles).
Now, look at how the price reacted to the Fibonacci lines after they were applied to the chart (these places are highlighted in orange rectangles).
As you can see at the current moment, the price, pushing off from line 38.2, has again approached a significant resistance level located on line 61.8 (this level, as you can see, repeatedly showed its strength in the last period of the price history).
In this case, we can assume that the price most likely will rebound from the level of 61.8 and go down to at least the level of 50.0 (and most likely even to the level of 38.2). But if suddenly this does not happen and the price nevertheless breaks the 61.8 line, then this will be an impulse of sufficient strength (since he managed to break through such a powerful level) in order to make a significant upward leap.
How can we use this situation?
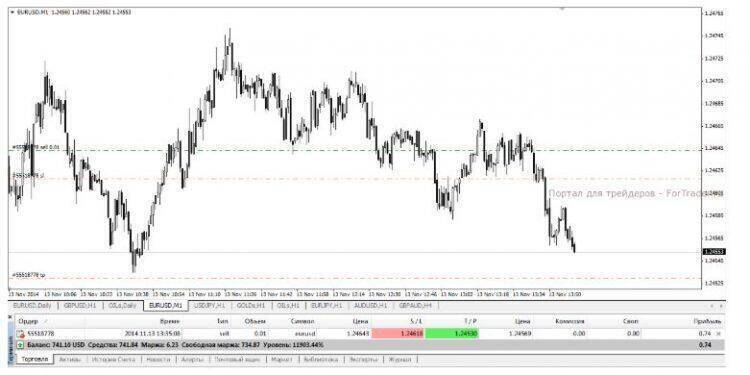
We open a sell position with take profit levels at the price values of lines 50.0 and 38.2 (on line 50.0, we close half of the position, moving stop loss to breakeven, and on line 38.2 we close the second half of the position). Put the stop loss level 50 points above the line 61.8 (as the previous price history shows, this level did not “pierce” a greater distance during the previous price turns on it).
At the same level where they installed Stop loss for the previous position (i.e., 50 points above the line 61.8), we set up a pending buy stop buy order. For this order, we also set stop orders:
- Stop loss order just below line 61.8
- A take profit order is at least 200 points higher (after all, as they said earlier if the price breaks this level, it will break it powerfully).
Thus, if we do not get profit in the first position, then with a high degree of probability, we will get it in the second position (and in such an amount that will cover the stop loss from the first). If you trade the same size, then with such a large stop loss you can suffer major losses, especially if you enter at one of the early Fibonacci retracement levels.
And yet, which method is better?
Choosing a method to set a stop loss is a fairly simple task if you have carefully analyzed the surrounding market environment using the fibonacci retracement tool we have studied. In one case, a closer protective stop is suitable; in other cases, the best solution is to put a stop loss away.
Of course, you need to get as far as possible from the Fibonacci lines themselves when looking for the best place to exit a position. Still, if you use the entire arsenal of tools, combining Fibonacci lines with other technical analysis tools, you can find the optimal level of protective stop and achieve a better reward to at risk.